Visualizing UDS Graphs
Decomp comes with a built-in interactive visualization tool using the UDSVisualization object. This object visualizes a UDSSentenceGraph.
A visualization (which is based on Dash) is served to your local browser via port 8050 (e.g. http://localhost:8050). The following snippet visualizes the first graph in the dev split:
graph = uds["ewt-dev-1"]
vis = UDSVisualization(graph)
vis.serve()
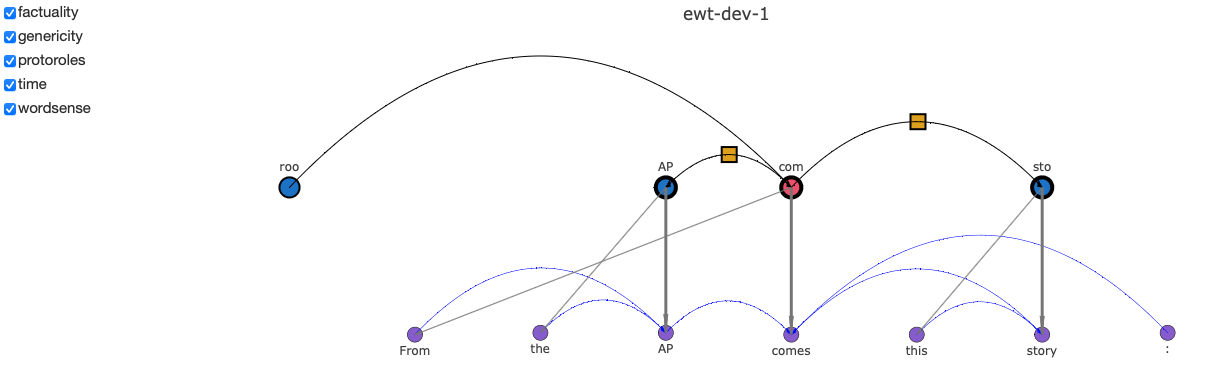
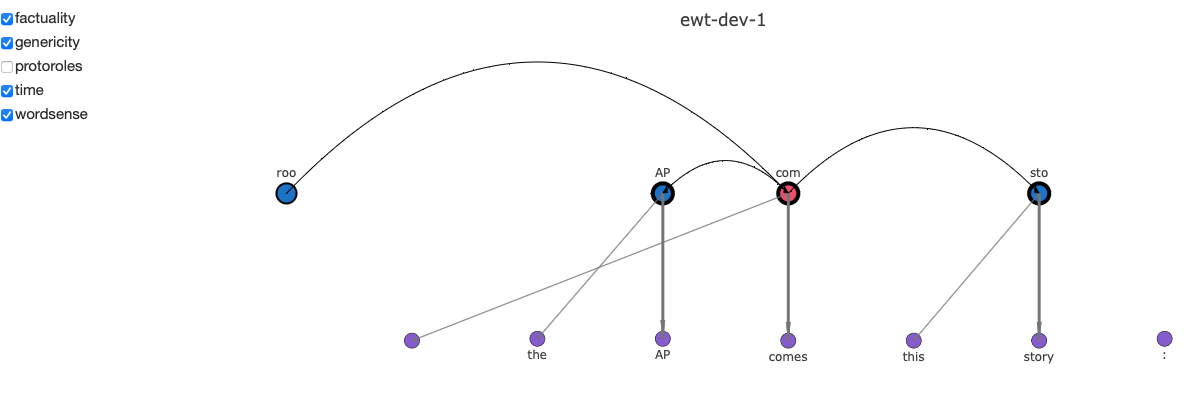
The browser window will look like this:
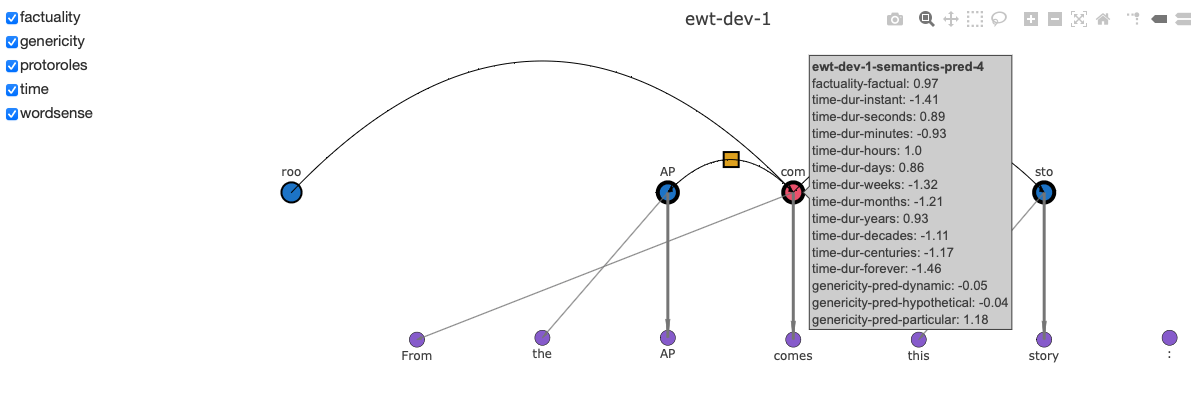
Black edges indicate edges in the semantic graph, while gray arrows are instance edges between semantics and syntax nodes. Thick gray arrows indicate the syntactic head of a semantic argument or predicate. Semantics nodes have a thick outline when they are annotated with decomp properties. Hovering over such a node will reveal the annotations in a pop-out window.
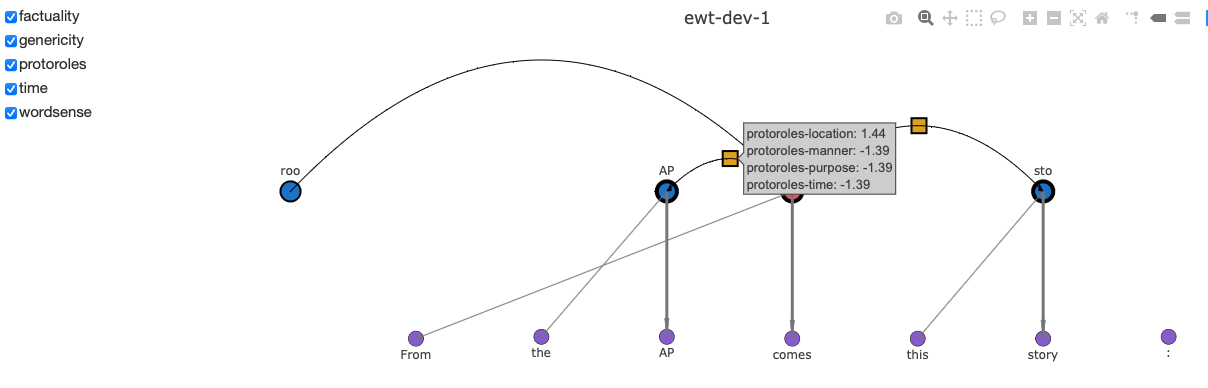
Similarly, yellow boxes on edges indicate protorole annotations, and can be hovered over to reveal their values.
Using the checkboxes at the top left, annotation subspaces can be selected and de-selected. If all the annotations for a node or edge are de-selected, it will become non-bolded or disappear
Several options can be supplied to a visualization via arguments. For example, we can visualize the syntactic parse along with the semantic parse by setting
vis = UDSVisualization(graph, add_syntax_edges = True)
which results in the following visualization.